NC Birth Weight Data
Shahrukh Khan May 6th, 2016
Brief Description
The data set contains 8 variables measured on 2000 infants born in North Carolina. The variables of the dataset are as follows:
- Patient.ID
- Mother Minority
- Mother Age
- Marital Status
- Mother Smoker
- Gender
- Number of Prenatal Visits
- Birth Weight Grams
Summary Statistics
Before diving into graphical procedures and corelation exploration, let's generate some general statistics and well define our data set. The following is a basic statistical summary of the 3 numeric variables we have in our dataset.
##              Mother.Age Birth.Weight.Grams Number.of.Prenatal.Visits
## median            27.00            3292.00                      8.00
## mean              27.05            3242.69                     11.83
## SE.mean            0.14              13.45                      0.21
## CI.mean.0.95       0.28              26.38                      0.42
## var               40.58          361754.21                     89.88
## std.dev            6.37             601.46                      9.48
## coef.var           0.24               0.19                      0.80
As for the categorical variables:
##   Gender Count Percentage
## 1 Female   968      48.4%
## 2   Male  1032      51.6%

##   Ethnicity Count Percentage
## 1  Nonwhite   597     29.85%
## 2     White  1403     70.15%

##   Marital.Status Count Percentage
## 1        Married  1178      58.9%
## 2      Unmarried   822      41.1%

##   Smoker Count        Percentage
## 1      N  1761 88.4036144578313%
## 2      Y   231 11.5963855421687%
Graphical Summaries


Investigating relationships
Boxplotting the Smoker vs Non-Smoker against Birth Weight. From the plot, it seems that mothers who smoke generally have babies which weigh less after birth.

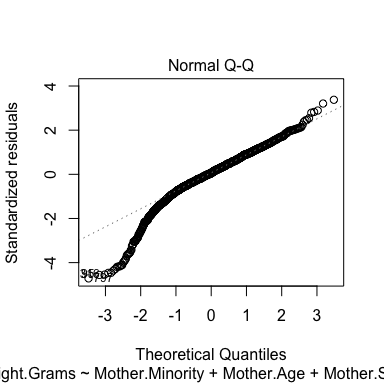
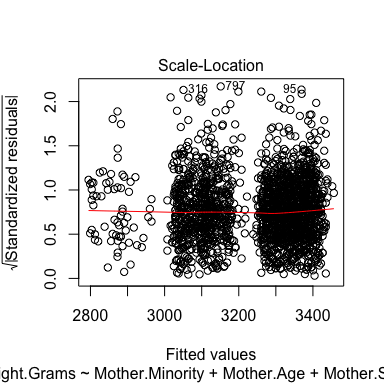
Carrying out a regression we can determine some interesting things; such as some important factors while determining birthweight are Mother.Smoker, Age etc.
##
## Call:
## lm(formula = Birth.Weight.Grams ~ Mother.Minority + Mother.Age +
##     Mother.Smoker + Gender, data = BirthData)
##
## Residuals:
##     Min      1Q  Median      3Q     Max
## -2754.3  -281.1    33.3   361.5  1970.2
##
## Coefficients:
##                      Estimate Std. Error t value             Pr(>|t|)
## (Intercept)           2951.10      60.68   48.64 < 0.0000000000000002 ***
## Mother.MinorityWhite   231.50      28.81    8.04   0.0000000000000016 ***
## Mother.Age               4.34       2.08    2.09               0.0370 *
## Mother.SmokerY        -230.03      41.08   -5.60   0.0000000244383149 ***
## GenderMale              74.36      26.23    2.83               0.0046 **
## ---
## Signif. codes:  0 '***' 0.001 '**' 0.01 '*' 0.05 '.' 0.1 ' ' 1
##
## Residual standard error: 585 on 1987 degrees of freedom
##   (8 observations deleted due to missingness)
## Multiple R-squared:  0.0545, Adjusted R-squared:  0.0525
## F-statistic: 28.6 on 4 and 1987 DF,  p-value: <0.0000000000000002